EDC Board of Supervisors Adopt updated Annual Residential and Employment Growth Rate
BOS Receives Staff Presentation at January 9, 2024 Meeting.
At the January 9, 2024 Board of Supervisors Meeting, the Department of Transportation provided a El Dorado Countywide Housing and Employment Projections, 2018 – 2045 Memorandum and Presentation pertaining to the 2024 Major Update of the Traffic Impact Fee (TIF) Program, recommending that the Board adopt an annual residential growth rate of 0.62% and an annual employment growth rate of 0.62% through 2045.
The annual residential and employment growth rates impacts the TIF formula, that helps to set the fee schedule for development fees for impacts to the El Dorado County Road Network.
This is the first time that a more detailed set of historical data for both residential growth, and employment growth has guided the analysis for the determination of the County-wide growth rate(s) – the data is based on Community Regions (El Dorado Hills, Cameron Park, Shingle Springs Diamond Springs/El Dorado, and Placerville Community Regions), and also incorporates Rural regions as “Balance of West Slope”. Key data points for Residential Growth indicated the following actual growth rates:
El Dorado Hills 3.30%
Cameron Park 0.44%
Shingle Springs 1.06%
Diamond Springs 0.23%
Placerville 0.10%
Balance of West Slope 0.62%
A PDF version of the Staff Presentation is located at the end of this article.


The Board of Supervisors voted 4 to 1 to approve the adopting of the updated residential and employment growth rates

DISCUSSION / BACKGROUND
This is the second workshop to discuss policy items, specifically data and information focused on growth rates and projections, related to the 2024 Major Update to the Traffic Impact Fee (TIF) Program.
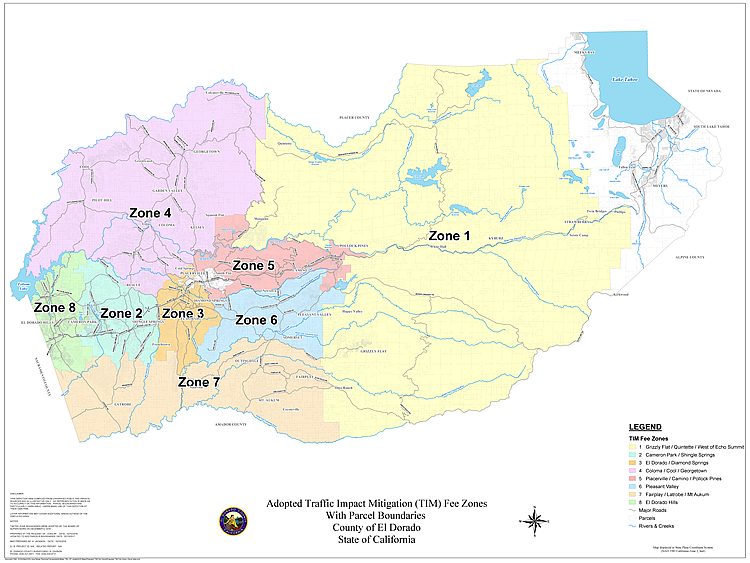
On December 8, 2020 (Item 39, Legistar 20-1585), the Board of Supervisors adopted the 2020 Major Update to the TIF Program. That update made a number of changes to the program, including adjusting the Countywide residential growth rate from 1.03% to 0.70% annually; setting the anticipated level of grant funding to 10%; reducing the non-residential equivalent dwelling unit (EDU) shift from 65% to 62%; consolidating the TIF Zones across the unincorporated West Slope from 8 Zones to 3 Zones; prorating fees for residential single-family dwellings based upon square footage, as required by California Assembly Bill (AB) 602; adding Vehicle Miles Traveled as a traffic impact measure under the California Environmental Quality Act (CEQA), as required by California Senate Bill (SB) 743; upholding the use of reduced fees for age-restricted housing; and upholding the offset for affordable housing as outlined in Board Policy B-14.
The 2024 Major Update to the TIF Program will consider the projected growth throughout the County through the year 2045; allocate the growth to community regions, including updates to those regions based upon the 2020 US Census; and update the County’s Travel Demand Model (TDM) to reflect the projected growth patterns. The Board will also be asked to consider the grant funding and non-residential offsets, based upon anticipated funding opportunities and the effects of residential growth upon commercial development. Utilizing the updated TDM, a deficiency analysis will be performed to establish a nexus with any needed capital improvements resulting from the projected growth, which will be included in the Capital Improvement Program (CIP), and the anticipated improvement costs will be distributed across the number of permits anticipated to be issued over the next twenty years to update the TIF Program Fee Schedule.
The workshop, held on December 5, 2023, launched the 2024 Major Update with the analysis of growth projections across the Western Slope of El Dorado County (West Slope) through 2045. The El Dorado County Housing and Employment Projections, 2018 – 2045 Memorandum (Memorandum) has been prepared by the County’s consultant, BAE Urban Economics, Inc. (BAE) (Attachment A).
Following the December 5th workshop, Transportation staff and their consultants collected historical data and information requested by the Supervisors for presentation and discussion at this workshop.
Base Year Housing and Employment Estimates
At this time, the extended growth projections utilize the same 2018 base year housing and employment estimates as those used in the growth projections used in the 2020 Major Update, which cover only the West Slope of the County. Growth within the Lake Tahoe Basin is under the jurisdiction of the Tahoe Regional Planning Agency (TRPA). BAE considered five sources of estimates for housing trends and four sources of estimates for jobs trends in the West Slope. For purposes of the analysis, BAE has chosen to use the 2019 County estimates compiled by Kimley-Horn & Associates (KHA) that are based on the County’s Geographic Information System (GIS) mapping data, as they are the most current, localized estimates available.
KHA is currently developing updated baseline estimates of existing West Slope housing units and employment. BAE will incorporate the updated baseline estimates into a refined set of West Slope housing unit and employment growth projections, using the annual growth rates to be adopted by the Board as a result of this item. Community Region growth allocations will also be included at separate, subsequent Planning Commission and Board of Supervisor meetings in early 2024. While the starting point for the projections will move up from 2018 to 2023, the average annual rates of housing unit and employment growth are not expected to change significantly.
Residential (Housing) Growth Rates
As shown in the Population/Housing Units/Households section of Table 1 in Attachment A, four of five projections studied yielded average annual growth rates for the period ranging between 0.53 and 0.73 percent. The fifth source (California Department of Finance Projections to 2045) yielded a negative average annual growth rate and is an anomaly within the data sources; as such, this outlier was not considered in estimating the County’s average annual residential growth rate. The current average annual residential growth rate adopted by the Board in 2020 is 0.70%.
Employment Growth Rates
In the Employment section of Table 1 in Attachment A, the 2018 to 2045 employment growth rates for three of the four sources range between 0.45 and 0.84 percent per year. The fourth source (2010 to 2023 Caltrans Growth Trended to 2045) is an anomaly and yielded an average annual growth rate more than twice the next highest employment growth rate; this outlier was not considered in estimating the County’s likely employment growth rate. The current average annual employment growth rate adopted by the Board in 2020 is 0.67%.
Housing Unit Projections
The Housing section of Table 2 in Attachment A shows housing unit projections for the West Slope from 2018 to 2045 based on the growth rates identified in Table 1. For planning purposes, BAE suggests that the County consider a growth projection that reflects the average of the residential projections, excluding the Department of Finance projection mentioned previously, shown in the Housing section of Table 2 in Attachment A. This would yield 9,996 new residential units for a total of 64,917 residential units in the West Slope area by 2045, yielding a 0.62% annual average residential growth rate. This is slightly higher than the County’s 2010 to 2018 growth estimates and the Sacramento Area Council of Governments (SACOG) 2040 projections, but less drastic than the growth rates suggested by the Department of Finance (DOF) and Caltrans.
Employment Projections
The Employment section of Table 2 in Attachment A shows a series of employment projections for the 2018 to 2045 period, drawing the potential employment growth rates from the Employment section of Table 1 in Attachment A and applying them to the County’s estimated 2018 West Slope base year jobs estimate. As with the residential growth projections, BAE suggests that the County use an average of the projections shown in the Jobs section of Table 2 for the purposes of projecting West Slope job growth for the 2018 to 2045 period, excluding the Caltrans Trended Growth projection. This yields an average annual employment growth rate of 0.62%, with 6,776 new jobs and a 2045 job total of 44,095.
Summary
Based on the data and methodology described above, BAE and Transportation recommend the County use the West Slope housing unit and employment growth assumptions outlined on page 4 of Attachment A for planning purposes:
The figures in the table on page 4 of Attachment A provide the County with growth assumptions that fall within the middle range of the growth projections available from various sources and data available for this study. Further, the recommended housing unit and employment growth rates suggest the County would be producing new housing at a rate that will correspond with the rate of new employment growth, meaning that the growth pattern would be balanced and the County’s jobs/housing balance would not deteriorate over time.
Assumption of too high of a growth rate could lead to unnecessary capital improvements and an overabundance of road capacity that surpasses county need, while too low of a growth rate would collect insufficient funds over time to cover the construction of projects required as a result of growth.
Next Steps
Based on input from the Board and direction from County staff, BAE will make any necessary refinements and finalize the West Slope growth projections. Then, BAE will analyze the pattern of growth within the West Slope and allocate the 2018 to 2045 housing unit and employment growth among Community Regions and the balance of the West Slope area. BAE will then review and discuss the refined projections and growth allocations with the Planning Commission and the Board to solicit input before finalizing the projections for the County’s planning purposes.
Staff is recommending that the Board adopt an annual residential growth rate of 0.62% and an annual employment growth rate of 0.62% for the period 2018 to 2045, and direct staff and BAE to commence allocation of the projected growth for presentation to the Planning Commission and Board of Supervisors.
ALTERNATIVES
The Board could choose a different annual growth projection within the ranges reflected in the analysis presented, or continue with the current annual rates of 0.70% for residential growth and 0.67% for non-residential growth. Staff and their consultants would need to search for documentation to support a growth projection that is not included in Attachment A.
PRIOR BOARD ACTION
On December 8, 2020 (Item 39, Legistar 20-1585), the Board adopted the 2020 Major Update to the TIF Program.
On December 5, 2023 (Item 37, Legistar 23-2051), the Board received a presentation on the 2024 Major Update to the TIF Program, including data regarding growth projection options.
OTHER DEPARTMENT / AGENCY INVOLVEMENT
Planning and Building Department, Long Range Planning Unit
CAO RECOMMENDATION / COMMENTS
Approve as recommended.
FINANCIAL IMPACT
There is no change to Net County Cost associated with this agenda item as the Major Update and associated administrative costs are covered by TIF collected and are included in the CIP budget for FY23/24 and FY24/25. The adopted growth rates will affect the number of assumed projects developed over the next twenty years throughout the West Slope of the County and could potentially result in an increase/decrease to the traffic impact fees charged for both residential and non-residential building permits.
CLERK OF THE BOARD FOLLOW UP ACTIONS
N/A
STRATEGIC PLAN COMPONENT
The TIF Program is a major funding source for the CIP, which is a vital part of the Infrastructure component of the County Strategic Plan. Adequate infrastructure is necessary for the Economic Development component and is a requirement of the County General Plan. Safe roads are a crucial factor in the Public Safety component of the County Strategic Plan.
 Loading...